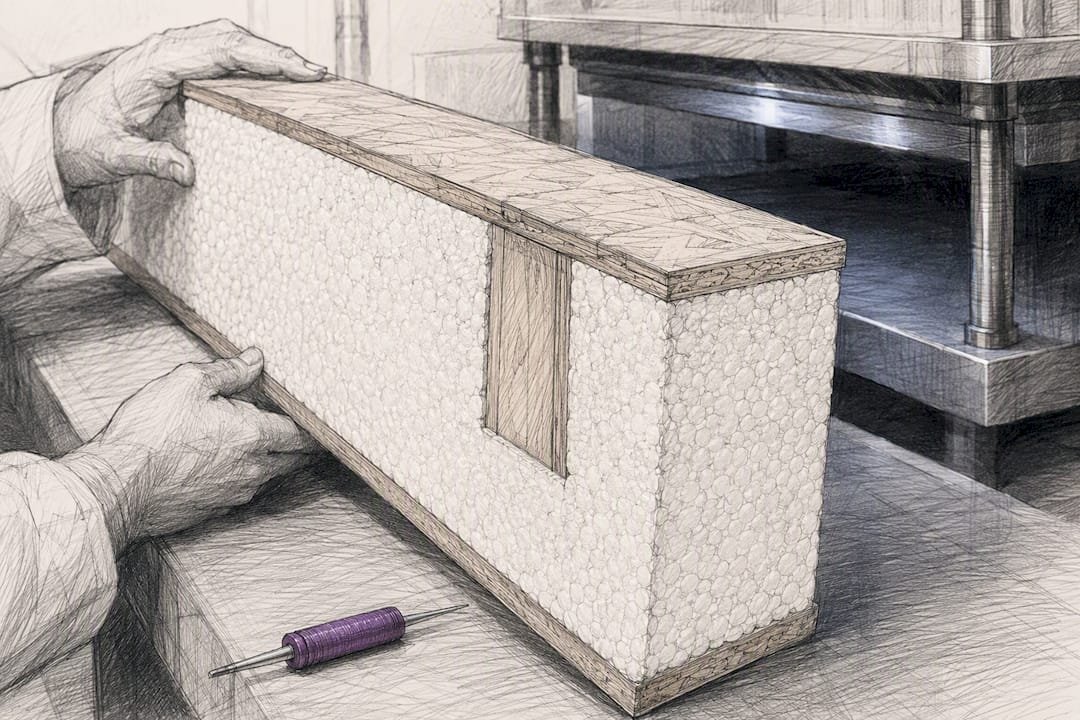
SIP R-value measures how well a structural insulated panel’s foam core resists heat flow, but the number stamped on a spec sheet is a lab figure, not a field guarantee. In most climates, SIP walls hold onto a large share of that rated performance because the panel is one continuous piece of insulation with almost no seams for air to sneak through. The right comparison tool isn’t the nominal R printed on the box. It’s whole-wall R or assembly U-factor, which accounts for framing, connections, and real air movement.
TL;DR:
- Whole-wall R or assembly U-factor provides a more accurate measure of SIP performance than nominal R values, accounting for framing and air movement.
- SIP walls typically outperform comparable stud walls in whole-wall tests due to lower framing factor and superior airtightness, often reducing air leakage to 7% of conventional walls.
- The R-value of foam cores like EPS is stable over time, while PUR/PIR panels can see a measurable decline in R-value as their blowing gases diffuse out.
- Homeowners should request tested U-factors and blower door results in contracts, not just nominal R values, to ensure real energy performance aligns with expectations.
- Factory-built SIP panels maintain their rated performance better than field-installed insulation due to controlled manufacturing conditions and consistent core density.
Table of Contents
- Nominal R vs Whole-Wall R: Why Lab Numbers Can Mislead
- How Core Material, Thickness, and Age Affect R
- Thermal Bridging and Airtightness: Where SIPs Win in the Field
- Quick SIP R-Value Reference by Core and Thickness
- How to Specify SIP R-Value: A Homeowner and Builder Checklist
- Why Factory-Built SIP Panels Close the Gap Between Rated and Real Performance
- What Homeowners Consistently Get Wrong About R-Value Shopping
- Where to Verify SIP Performance Claims Yourself
- Sources
Nominal R vs Whole-Wall R: Why Lab Numbers Can Mislead
The R-value on a SIP data sheet comes from a guarded hot plate test: a small foam sample sandwiched between temperature-controlled plates at 75°F, with zero air movement and no framing anywhere near it. That number tells you the core material’s raw resistance. It does not tell you what happens once studs, headers, top plates, and window bucks interrupt the foam.
Every wall assembly loses some performance to what builders call the framing factor: the percentage of the wall that’s solid wood or connection material instead of insulation. Wood conducts heat far faster than foam, so more framing means a lower whole-wall R even if the nominal number stays the same.
This is where SIPs pull ahead. Because panels are largely continuous foam with minimal internal framing, SIPA testing and ORNL whole-wall data show SIP assemblies routinely beating similarly rated Matt-insulated stud walls once you measure the whole wall instead of the material alone.
A few things drive that gap:
- Batt walls lose R at every stud, top plate, header, and electrical box.
- SIP walls interrupt the foam only at panel splines and rare connection points.
- Guarded hot plate tests exclude air movement, but real walls face wind and pressure differences.
- Whole-wall testing captures all of this; nominal R testing captures none of it.
How Core Material, Thickness, and Age Affect R
Not all foam cores perform the same, and the differences matter when you’re comparing quotes. Expanded polystyrene (EPS) typically measures R-3.8 to R-4.4 per inch, and it actually gets slightly better in cold weather rather than worse. Graphite polystyrene (GPS) runs a bit higher per inch than standard EPS because embedded graphite particles reflect radiant heat. Polyurethane and polyisocyanurate (PUR/PIR) start higher still, often R-6 or more per inch, but that number isn’t fixed for life.
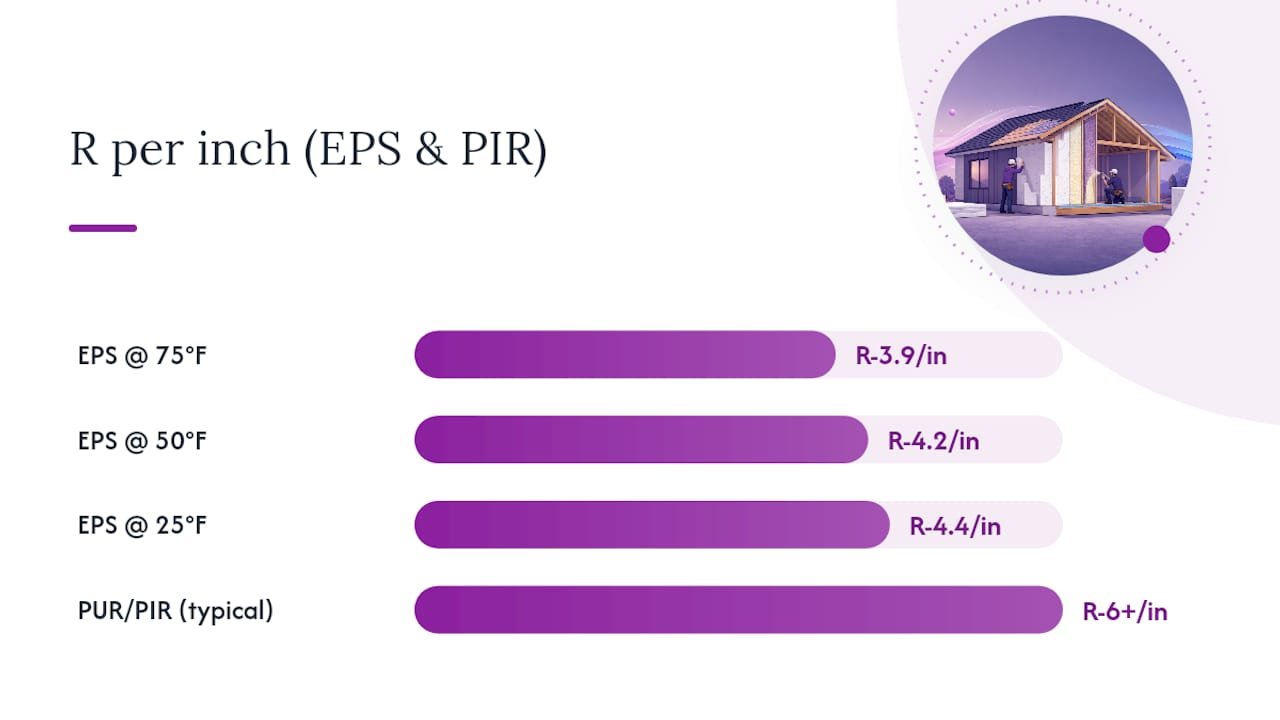
Here’s the statistic that matters most for anyone comparing panels: EPS tested at 75°F measured R-3.9, then R-4.2 at 50°F and R-4.4 at 25°F in side-by-side lab work. Cold weather makes EPS work slightly better, not worse.
PUR/PIR behaves differently over time. Its blowing gas diffuses out of the cell structure gradually, so its rated R can drift downward over years. Manufacturers publish “aged R” figures precisely because of this. EPS and GPS, by contrast, use air-stable cell chemistry, so their R-value stays essentially flat over the panel’s service life.
- 3.5-inch EPS panel: roughly R-14 nominal
- 5.5-inch EPS panel: roughly R-22 nominal
- Thicker cores or GPS/PIR: higher nominal R per inch, but confirm aged figures before you compare
Thermal Bridging and Airtightness: Where SIPs Win in the Field
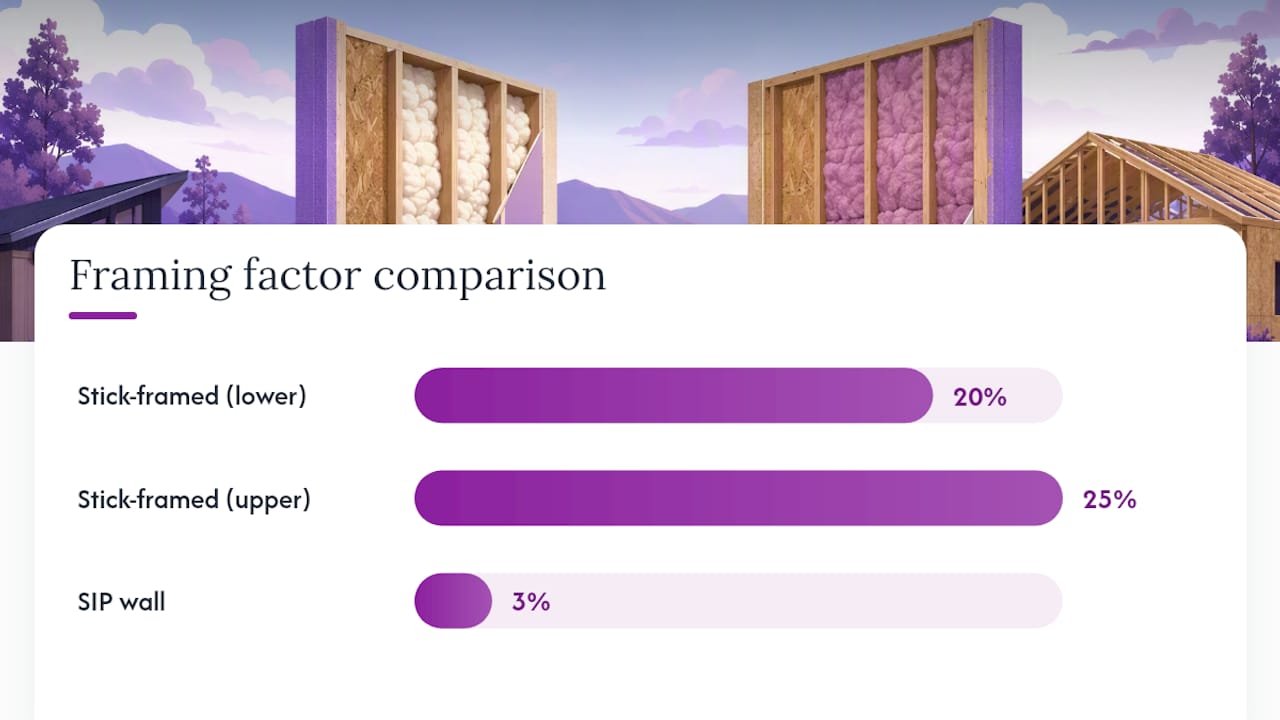
Framing factor is where the real separation happens. A typical stick-framed wall runs a framing factor of 20 to 25 percent once you count studs, plates, corners, and headers. A SIP wall’s framing factor sits around 3 percent, limited mostly to panel splines and connection points. That gap alone explains why two walls with the same nominal R can perform very differently once installed.
Airtightness compounds the advantage. Side-by-side ORNL comparisons found SIP structures leaking only about 7 percent as much air as comparable conventionally framed structures tested under blower door conditions. Typical stick-built homes without dedicated air-sealing often land in the 5 to 10 ACH50 range; well-built SIP homes commonly test below 1 to 3 ACH50.
That tightness changes three things on a real job:
- HVAC equipment can often be sized smaller, since the heating and cooling load drops with the leakage rate.
- Cold spots near corners and headers largely disappear, since there’s no exposed stud line pulling heat out.
- Moisture risk drops, because uncontrolled air leakage is what carries humid air into wall cavities where it condenses.
Pro Tip: Ask your panel supplier for their tested ACH50 range from a real blower door test on a comparable build, not a theoretical number from a spec sheet. Field data beats a marketing claim every time.
Quick SIP R-Value Reference by Core and Thickness
Thickness and core material together determine nominal R, but the whole-wall number you’ll actually feel in your energy bill runs a bit lower once splines and connections are factored in. Use this as a starting point when you’re comparing quotes, not a final answer.
For colder climate zones, adding a thicker core or a layer of exterior continuous insulation is usually more reliable than chasing a marginally higher per-inch rating on paper.
How to Specify SIP R-Value: A Homeowner and Builder Checklist
Getting a labeled R-value that actually predicts your energy bill comes down to what you put in the contract, not what’s printed on the panel. Run through this before you sign anything:
- Request the whole-wall U-factor or an assembly-level energy model, not just the core material’s nominal R. U-factor is the metric SIPA recommends for comparing different wall systems fairly.
- Ask for core material, foam density, and aged R-value, especially for PUR/PIR panels where initial and long-term numbers differ.
- Specify connection and air-seal details in writing, including a target ACH50 from a blower door test after completion.
- Match your target R to your climate zone, since IECC and DOE guidance sets different insulation targets by region rather than one national number.
- Weigh cost against real need: a retrofit addition in a mild climate doesn’t need the same core thickness as new construction in a northern zone.
A blower door target and a written U-factor are the two contract items most likely to keep your actual build in line with what you were quoted. If you’re mapping out a modular room addition or comparing installation details for SIP walls, get these numbers before you finalize a design.
Pro Tip: If two quotes list the same nominal R but wildly different prices, ask what framing factor and air-seal method each one assumes. That’s usually where the price difference actually comes from.
Why Factory-Built SIP Panels Close the Gap Between Rated and Real Performance
Field-installed insulation depends on whoever’s holding the tool that day. Batts get compressed, gaps get missed, vapor barriers get stapled wrong. A factory-built panel doesn’t have that variability baked in. Core density and adhesive bonding happen under controlled conditions before the panel ever reaches a job site, which is a big part of why SIP walls tend to hold their rated performance better than field-assembled alternatives.
Some factory kit approaches feature panels with consistent core density and integrated air control already built in, reducing onsite variability and shrinking build timelines from months to days. If you want to see how core thickness and material options translate into real specs, the structural insulated sandwich panels product pages list assembly details worth comparing against whatever your local contractor is quoting. Browsing the full product catalog is a reasonable next step before you commit to a design.
What Homeowners Consistently Get Wrong About R-Value Shopping
Most people shopping for insulation compare the wrong number. They put two products side by side, see one says R-22 and the other says R-19, and assume the R-22 option wins. That comparison only holds if both products were tested the same way and installed with the same framing factor and air-sealing, which is almost never true when you’re comparing a SIP wall to a stick-framed wall.
The bigger blind spot is aging. Buyers fixate on initial R-value and never ask what a panel measures five or ten years out. For EPS and GPS cores, that question barely matters since the number holds steady. For PUR/PIR, it matters quite a bit, and a supplier who won’t share aged R data is giving you half the picture on purpose.
If there’s one habit worth building before you buy any insulated panel system, it’s this: stop asking “what’s the R-value?” and start asking “what’s the whole-wall U-factor, and can you show me a blower door result from a real build?” That single question filters out most of the marketing noise in this industry. It also happens to be the same question that separates a supplier confident in their product from one hoping you won’t ask.
— Kian
Where to Verify SIP Performance Claims Yourself
For deeper technical detail, the Structural Insulated Panel Association’s whole-wall data and its SIP technical guidance PDF cover testing methodology in full. BuildingScience.com’s high-R wall assembly research breaks down core material comparisons in more depth, and envelope details beyond the wall itself, like energy-efficient interior doors, round out the whole-house picture.
Sources
- R-Values in the Real World | Structural Insulated Panel Association
- High‑R wall assemblies: SIP wall construction | BuildingScience